# Reset plotting parameters
par(mfrow = c(1, 1), mar = c(5, 4, 4, 2) + 0.1)
# ==============================================================================
# SAVE HIGH-RESOLUTION VERSIONS TO OUTPUT DIRECTORY
# ==============================================================================
# Save individual plots with better visibility
png(file.path(output_path, "s3_ridge_paths.png"), width = 1200, height = 800, res = 150)
par(mar = c(6, 5, 8, 3), cex.lab = 1.4, cex.axis = 1.3, cex.main = 1.6)
plot(fit_ridge, xvar = "lambda", label = TRUE, col = viridis(7), lwd = 2.5)
title("RIDGE REGRESSION (α = 0) - Shrinks coefficients together", line = 3.5)
abline(v = log(cv_ridge$lambda.min), lty = 2, col = "red", lwd = 3)
abline(v = log(cv_ridge$lambda.1se), lty = 2, col = "chocolate3", lwd = 3)
text(x = log(cv_ridge$lambda.min), y = max(coef(fit_ridge)[-1,1]) * 0.9,
labels = "λ.min", pos = 4, col = "red", cex = 1.5, font = 2)
text(x = log(cv_ridge$lambda.1se), y = max(coef(fit_ridge)[-1,1]) * 0.75,
labels = "λ.1se", pos = 2, col = "chocolate3", cex = 1.5, font = 2)
dev.off()
png(file.path(output_path, "s3_lasso_paths.png"), width = 1200, height = 800, res = 150)
par(mar = c(6, 5, 8, 3), cex.lab = 1.4, cex.axis = 1.3, cex.main = 1.6)
plot(fit_lasso, xvar = "lambda", label = TRUE, col = viridis(7), lwd = 2.5)
title("LASSO REGRESSION (α = 1) - Variable selection", line = 3.5)
abline(v = log(cv_lasso$lambda.min), lty = 2, col = "red", lwd = 3)
abline(v = log(cv_lasso$lambda.1se), lty = 2, col = "chocolate3", lwd = 3)
text(x = log(cv_lasso$lambda.min), y = max(coef(fit_lasso)[-1,1]) * 0.9,
labels = "λ.min", pos = 4, col = "red", cex = 1.5, font = 2)
text(x = log(cv_lasso$lambda.1se), y = max(coef(fit_lasso)[-1,1]) * 0.75,
labels = paste0("λ.1se (", nz_lasso, " vars)"), pos = 2, col = "chocolate3", cex = 1.5, font = 2)
dev.off()
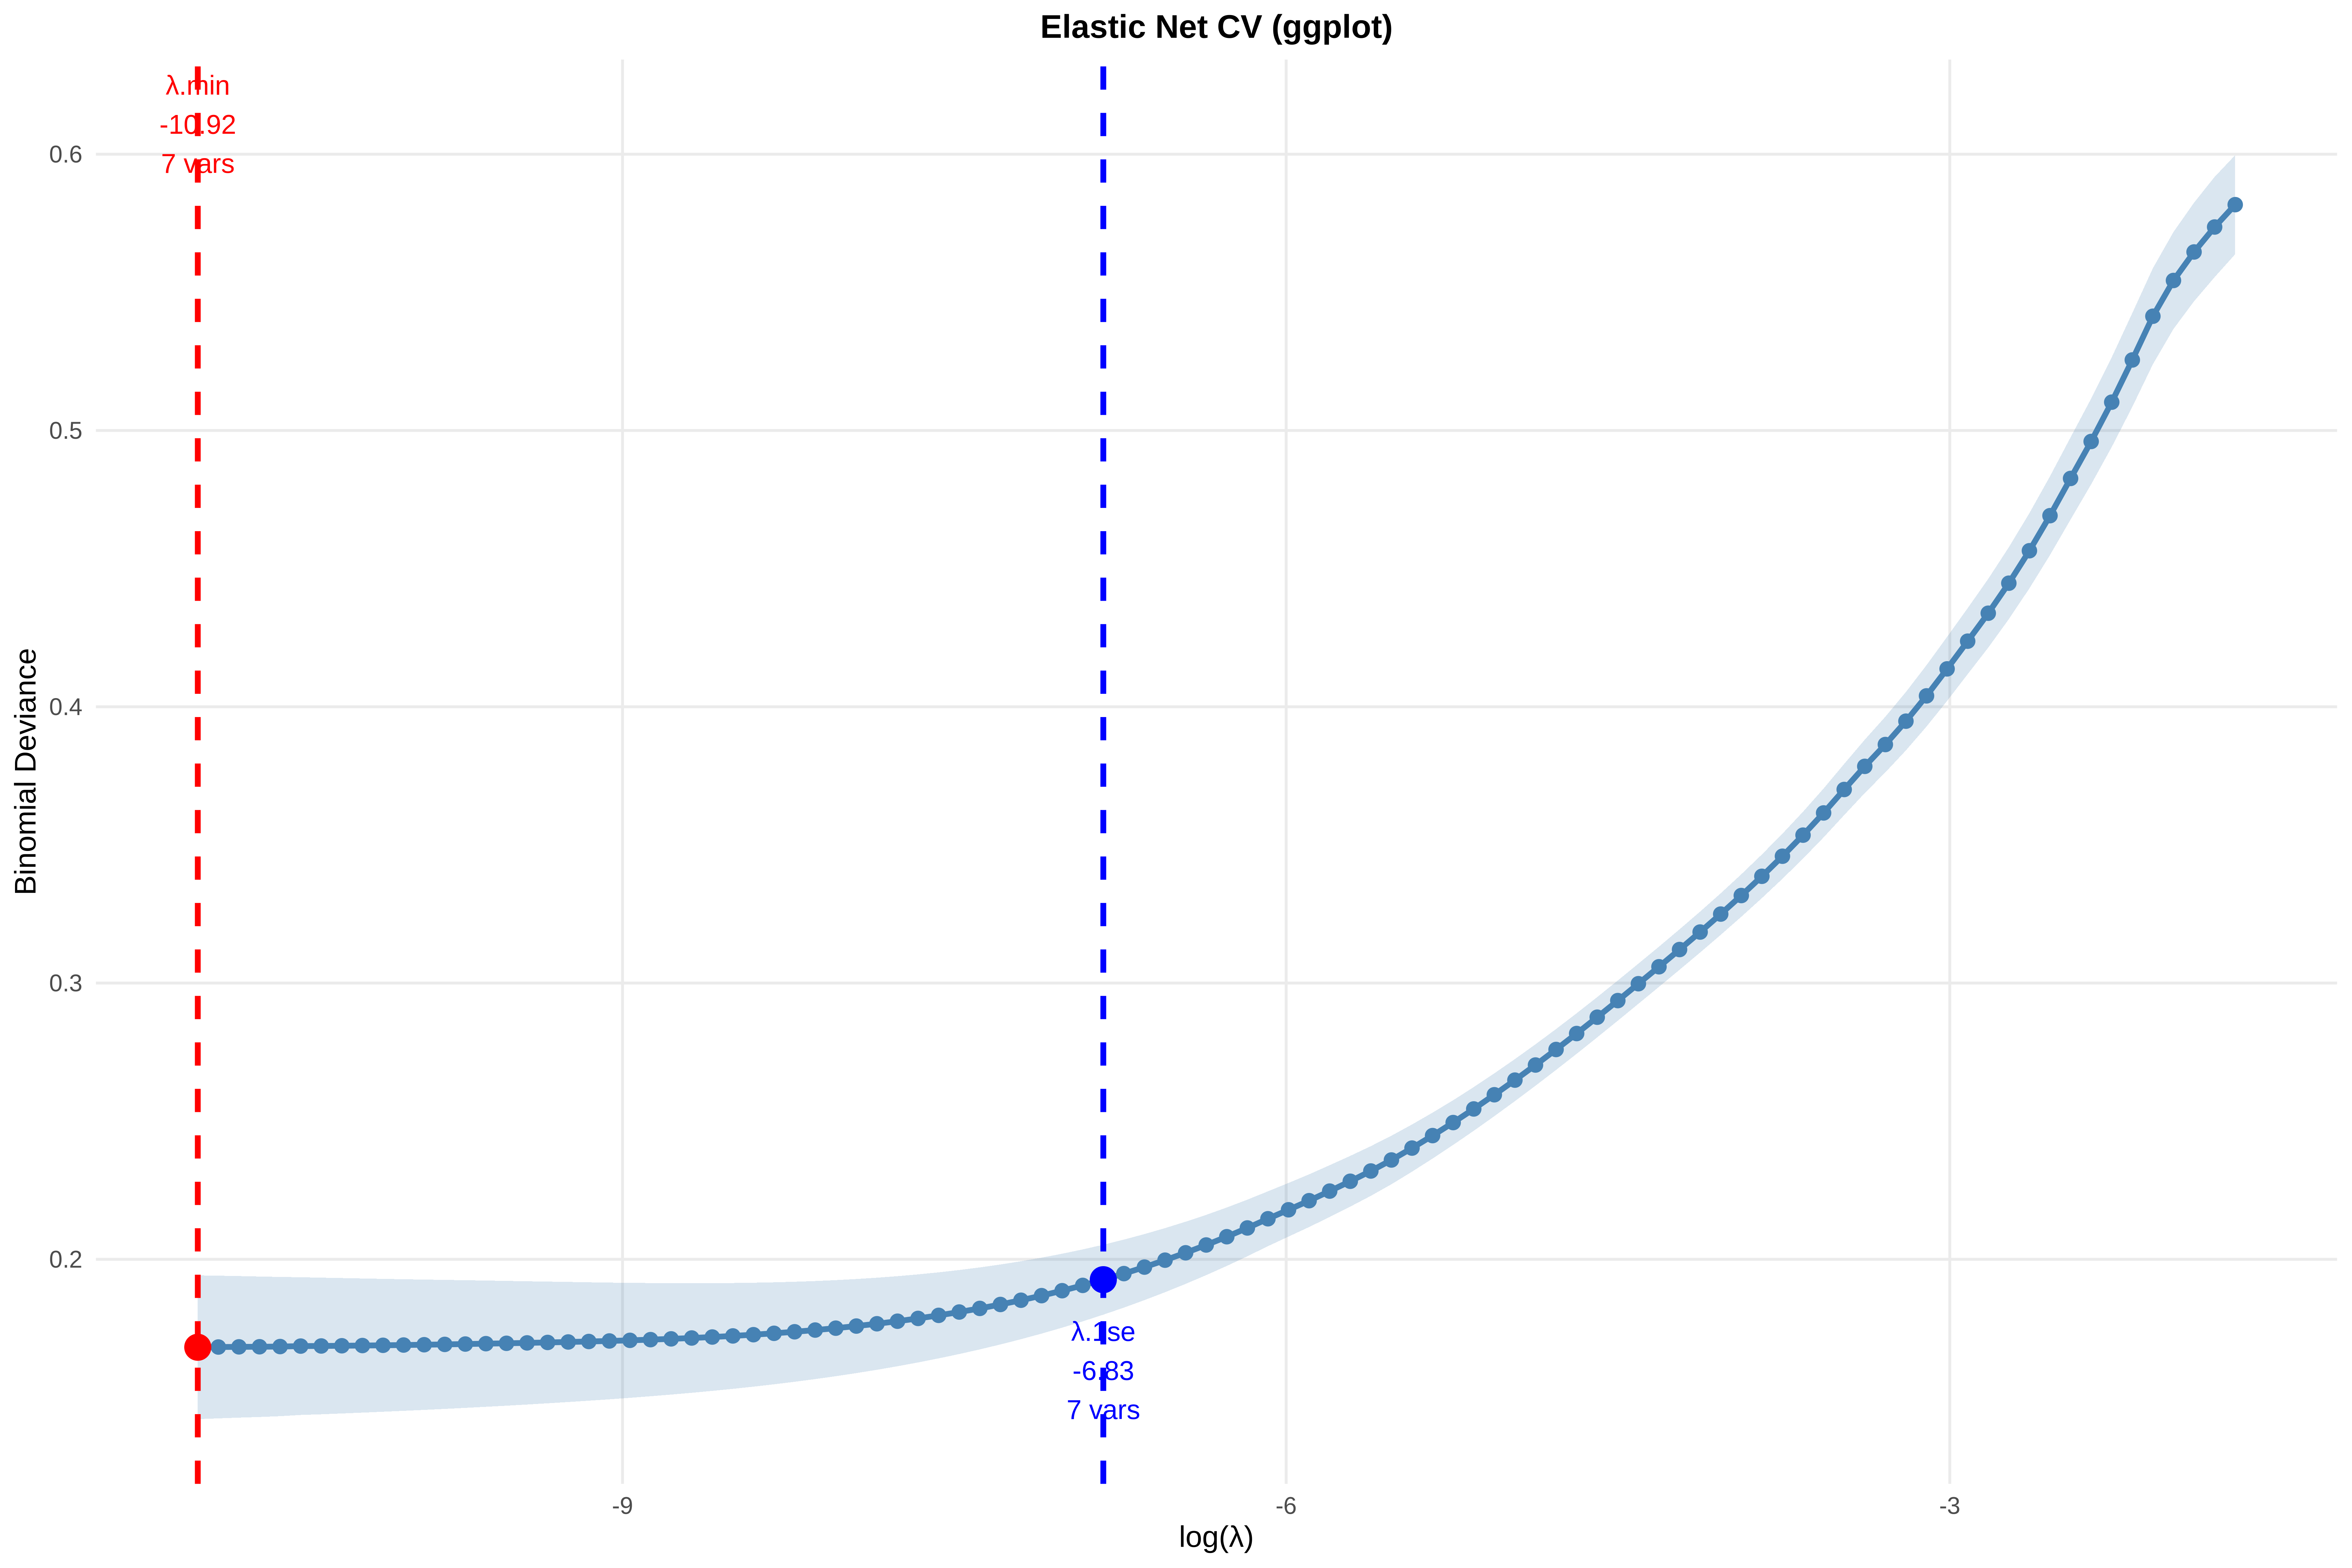
png(file.path(output_path, "s3_enet_paths.png"), width = 1200, height = 800, res = 150)
par(mar = c(6, 5, 8, 3), cex.lab = 1.4, cex.axis = 1.3, cex.main = 1.6)
plot(fit_enet, xvar = "lambda", label = TRUE, col = viridis(7), lwd = 2.5)
title("ELASTIC NET (α = 0.5) - Compromise: groups correlated variables", line = 3.5)
abline(v = log(cv_enet$lambda.min), lty = 2, col = "red", lwd = 3)
abline(v = log(cv_enet$lambda.1se), lty = 2, col = "chocolate3", lwd = 3)
text(x = log(cv_enet$lambda.min), y = max(coef(fit_enet)[-1,1]) * 0.9,
labels = "λ.min", pos = 4, col = "red", cex = 1.5, font = 2)
text(x = log(cv_enet$lambda.1se), y = max(coef(fit_enet)[-1,1]) * 0.75,
labels = paste0("λ.1se (", nz_enet, " vars)"), pos = 2, col = "chocolate3", cex = 1.5, font = 2)
dev.off()
# Save a combined high-res version
png(file.path(output_path, "s3_all_coefficient_paths.png"), width = 2400, height = 800, res = 200)
par(mfrow = c(1, 3), mar = c(6, 5, 8, 3), cex.lab = 1.4, cex.axis = 1.3, cex.main = 1.6)
# Ridge
plot(fit_ridge, xvar = "lambda", label = TRUE, col = viridis(7), lwd = 2.5)
title("RIDGE (α=0)", line = 3.5)
abline(v = log(cv_ridge$lambda.min), lty = 2, col = "red", lwd = 3)
abline(v = log(cv_ridge$lambda.1se), lty = 2, col = "chocolate3", lwd = 3)
text(x = log(cv_ridge$lambda.min), y = max(coef(fit_ridge)[-1,1]) * 0.9,
labels = "λ.min", pos = 4, col = "red", cex = 1.3)
text(x = log(cv_ridge$lambda.1se), y = max(coef(fit_ridge)[-1,1]) * 0.75,
labels = "λ.1se", pos = 2, col = "chocolate3", cex = 1.3)
# LASSO
plot(fit_lasso, xvar = "lambda", label = TRUE, col = viridis(7), lwd = 2.5)
title("LASSO (α=1)", line = 3.5)
abline(v = log(cv_lasso$lambda.min), lty = 2, col = "red", lwd = 3)
abline(v = log(cv_lasso$lambda.1se), lty = 2, col = "chocolate3", lwd = 3)
text(x = log(cv_lasso$lambda.min), y = max(coef(fit_lasso)[-1,1]) * 0.9,
labels = "λ.min", pos = 4, col = "red", cex = 1.3)
text(x = log(cv_lasso$lambda.1se), y = max(coef(fit_lasso)[-1,1]) * 0.75,
labels = paste0("λ.1se (", nz_lasso, " vars)"), pos = 2, col = "chocolate3", cex = 1.3)
# Elastic Net
plot(fit_enet, xvar = "lambda", label = TRUE, col = viridis(7), lwd = 2.5)
title("ELASTIC NET (α=0.5)", line = 3.5)
abline(v = log(cv_enet$lambda.min), lty = 2, col = "red", lwd = 3)
abline(v = log(cv_enet$lambda.1se), lty = 2, col = "chocolate3", lwd = 3)
text(x = log(cv_enet$lambda.min), y = max(coef(fit_enet)[-1,1]) * 0.9,
labels = "λ.min", pos = 4, col = "red", cex = 1.3)
text(x = log(cv_enet$lambda.1se), y = max(coef(fit_enet)[-1,1]) * 0.75,
labels = paste0("λ.1se (", nz_enet, " vars)"), pos = 2, col = "chocolate3", cex = 1.3)
dev.off()
par(mfrow = c(1, 1))
cat("\n✓ Enhanced coefficient path plots displayed above\n")
cat("✓ High-resolution versions saved to output directory:\n")
cat(" ", file.path(output_path, "s3_ridge_paths.png"), "\n")
cat(" ", file.path(output_path, "s3_lasso_paths.png"), "\n")
cat(" ", file.path(output_path, "s3_enet_paths.png"), "\n")
cat(" ", file.path(output_path, "s3_all_coefficient_paths.png"), "\n")